
ORACLE
SNOWGLOBE
I developed a UI interface for a versatile full-stack platform that combines facial/image recognition, natural language processing, and geospatial mapping to identify, track, and analyze entities.
UI Design
Design Strategy
Team Collaboration
User Experience
Service Design
UI Design Design Strategy Team Collaboration User Experience Service Design
Winning the hackathon competition
Our team participated in Madhacks, a yearly hackathon event where Oracle engineers from various cities and countries can participate and share their projects and demonstrate their skills to solve real world problems using oracle technology.
Snowglobe won 1st place in the local, regional and global hackathon competition against other teams who participated in the hackathon.
Role: UX designer
Time: August - September 2019
The Problem
The goal of this project was to leverage Oracle’s technology and domain expertise to support anti-trafficking organizations in identifying and locating victims more effectively.
These organizations often rely on fragmented data sources and manual processes, making it difficult to connect critical signals in a timely manner. To address this, we set out to design a versatile, full-stack platform that integrates facial and image recognition, natural language processing, and geospatial mapping. By bringing these capabilities into a unified system, the platform enables users to identify, track, and analyze individuals and related data points more efficiently, supporting faster and more informed decision-making in high-stakes scenarios.
Project goals:
Win the hackathon competition to receive funds for the project.
Develop a unified platform hosted on Oracle Cloud Infrastructure.
Utilize oracle products and services to power the Snowglobe platform.
Expand the use of Snowglobe to private investigators in the U.S and other countries.
Risks & Constraints:
Lack of user and competitive research.
We had 3 weeks to develop a design before joining a hackathon competition.
Lack of funds to perform research.
Understanding the Need
Due to the time constraints of the hackathon, we were unable to conduct formal user research prior to development. To mitigate this, we partnered closely with subject matter experts who provided critical domain knowledge and helped us shape initial assumptions around user needs and priorities.
These insights informed our early product direction, which we then validated through targeted usability testing. Based on this approach, we identified key user goals: enabling efficient data ingestion into the system, monitoring recent social media activity, tracking last known locations, and generating actionable analytics reports.
Prioritization
To help speed the development process, I conducted a feature prioritization exercise to help determine the time and resources required to develop the platform front-end. By narrowing down the features of the platform, the team will be able to speed the development process by focusing on the goals we set about the users.

Performed a features prioritization exercise with the team.
Features prioritization insights
Search feature: Ability to search cases and pull victims information
Visualization maps and graphs: Visualize data sets and find trend patterns, machine learning and connect to various data sources.
Video Feed: Camera inputs allows us to track video footage from different cameras in different locations.
Social media feed: Track victims using social media, scraping specific tweets containing keywords from a user’s twitter feed. It also attempts to fetch any tweet metadata like timestamp, location, mentioned users.
Tying Technologies Together
The engineering team in the Oracle Innovation Hub developed the Snowglobe project components by combining other Oracle products and services together, to deliver powerful features to be utilized in locating trafficking victims. The components were developed independently, and the engineers wanted to design a platform that combines the components together with an easy-to-use interface.
We started by conducting a team meeting to discuss the project problem, project goals, and identify any constraints and risks.

Whiteboard exercise with the engineering team.
Concept Validation
Following feature prioritization, I translated key requirements into low-fidelity wireframes to define the interface and interaction model, and developed an interactive prototype to support early concept validation. This allowed us to quickly test assumptions and ensure alignment with core user goals before investing in high-fidelity design.
I conducted two rounds of concept validation sessions with four participants in each round, focusing on critical workflows. Participants were asked to (1) generate an analytics report using the Oracle Analytics Cloud plugin and (2) identify and extract a victim’s social media footprint. These sessions helped validate usability, uncover friction points, and refine the experience to better support efficiency and clarity in high-stakes scenarios.
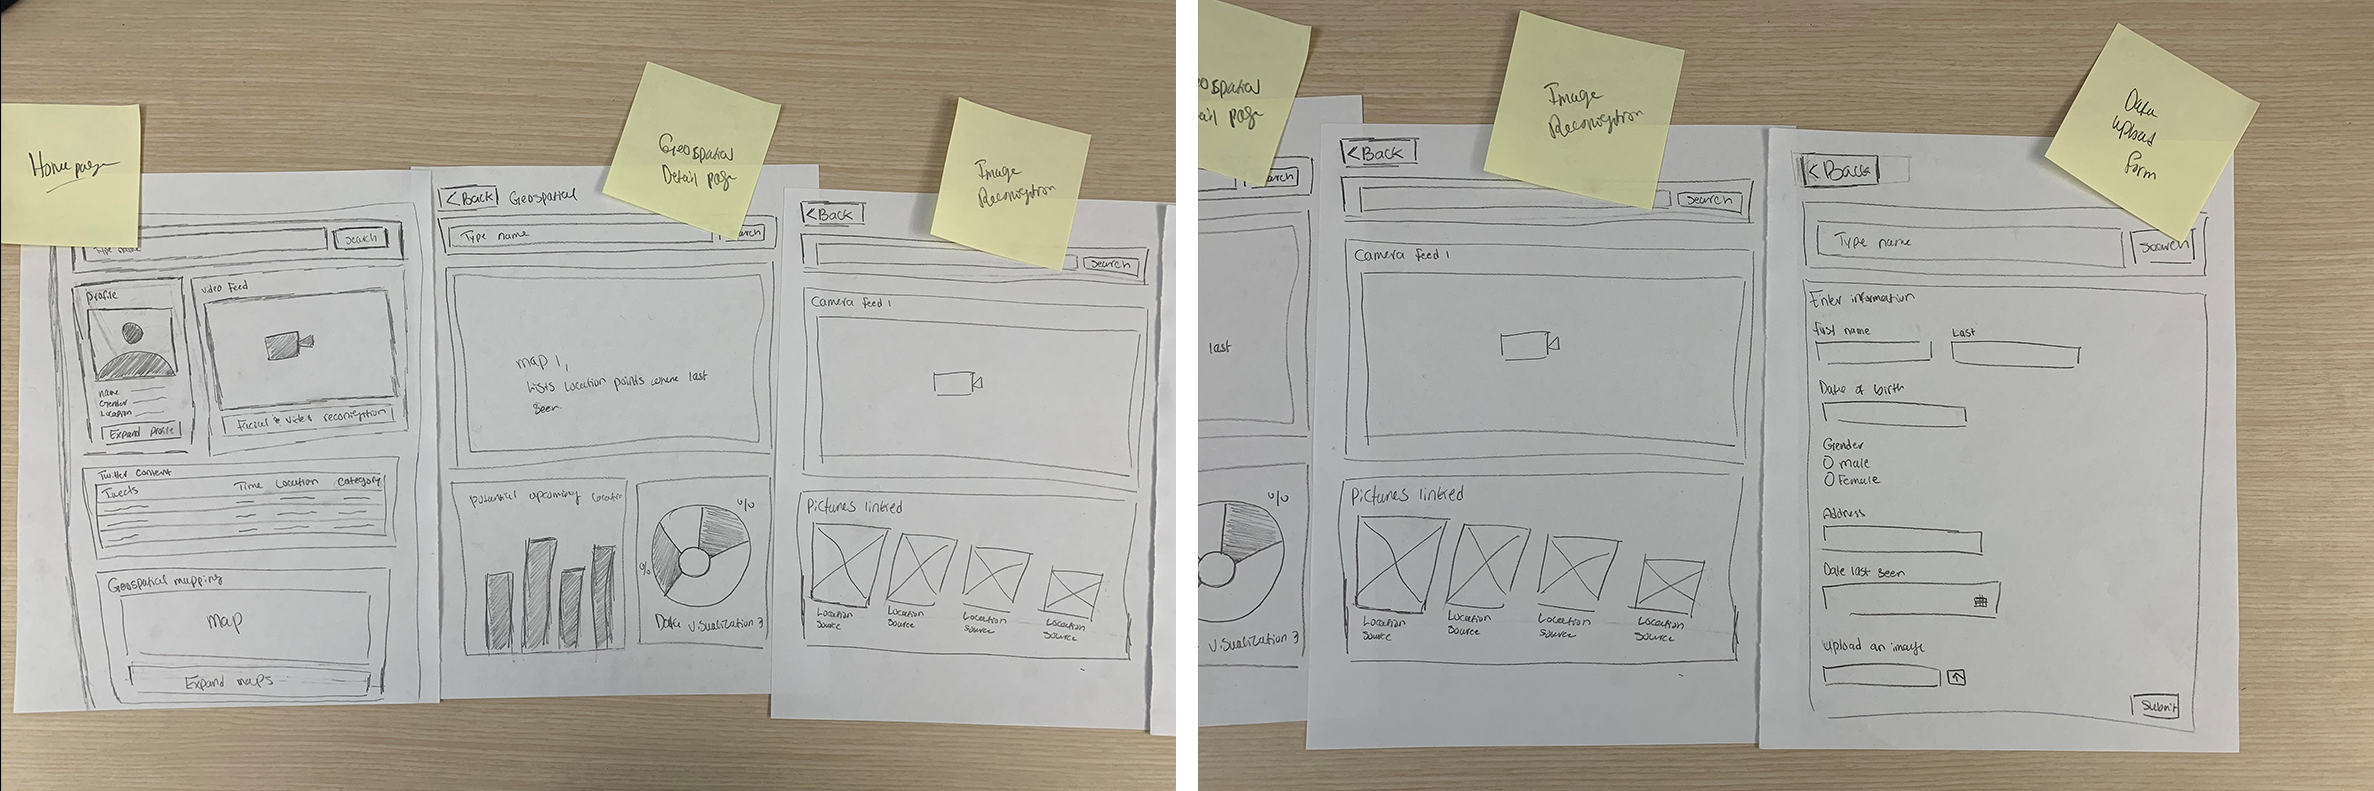
Lo-fi wireframes to conduct concept validation
Outcomes
Users had difficulty navigating between different pages to browse all the features.
Users were able to easily find victims, but were not able to understand the latitude/longitude numbers. (ex: 44.1247 N, 73.8693 W).
Loading time also was a challenge that impacted the performance of the features.

Gathering feedback after user testing on the Lo-fi wireframes.
After validation
We combined the multiple pages into a single page application with multiple tabs and sub tabs.
We added location as city, state with the latitude/longitude numbers as a supplement.
We enhanced the connections to the database and the oracle analytics cloud visualization dashboards by implementing a python script to only show the visualizations requested by the user.
Features
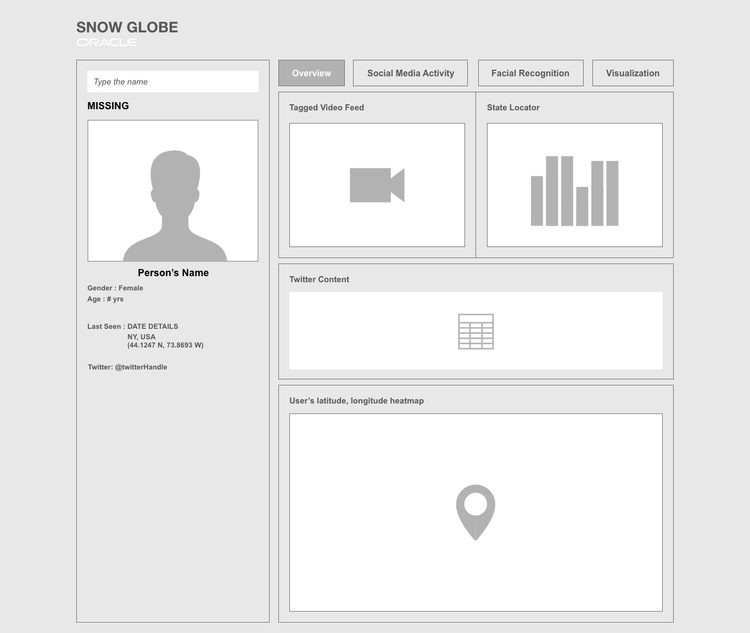
Overview Dashboard
The Overview provides a centralized snapshot of the individual being investigated, combining key identifying details with contextual metadata. It highlights essential attributes such as name, age, gender, last known location, and associated social handle, allowing users to quickly establish context before diving deeper. This section acts as the anchor of the experience, ensuring that all subsequent insights remain tied to a clear subject profile.
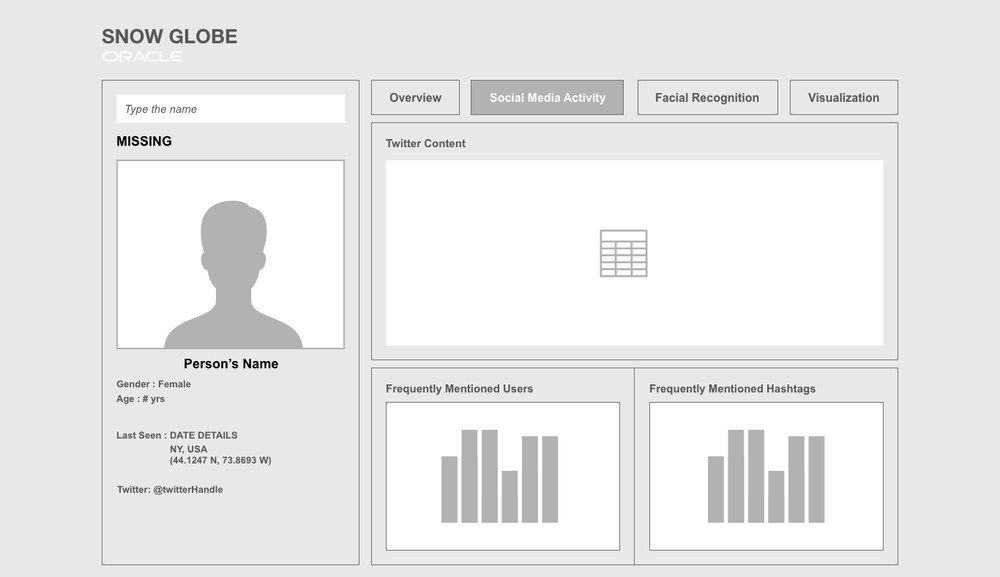
Social Media Activity
The Social Media Activity section aggregates and visualizes the individual’s digital footprint across platforms, with a focus on Twitter-derived data. It surfaces patterns through tagged video feeds, content summaries, frequently mentioned users, and trending hashtags, enabling users to identify behavioral trends and social connections. Supporting visualizations like location heatmaps provide additional spatial context, helping users interpret activity across time and geography.
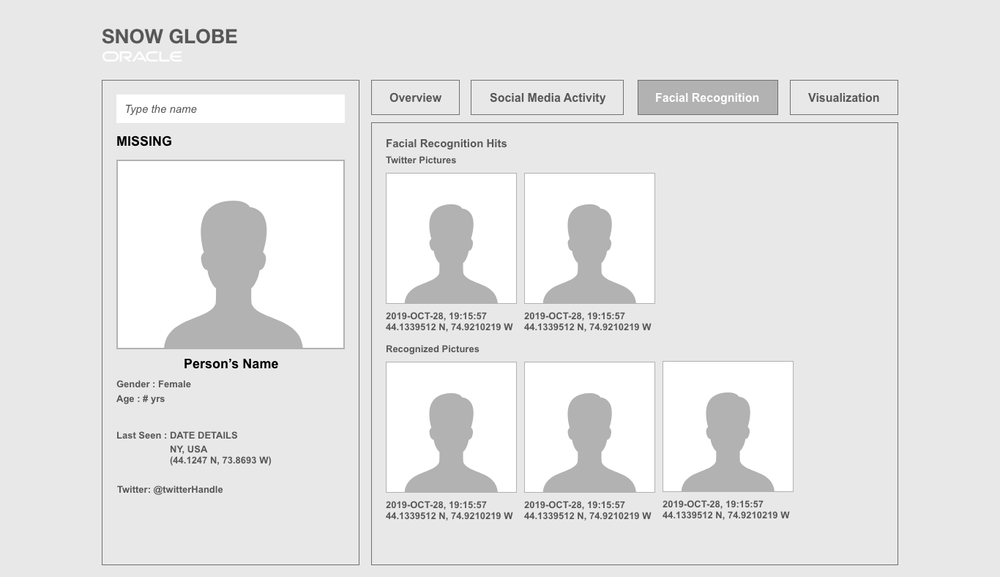
Facial Recognition
The Facial Recognition section presents AI-generated matches across collected imagery, organizing detected appearances into categorized results such as social media hits and recognized instances. Each result is paired with timestamps and geolocation data, allowing users to trace when and where the individual may have been identified. This section supports rapid visual verification and strengthens investigative confidence through pattern recognition.
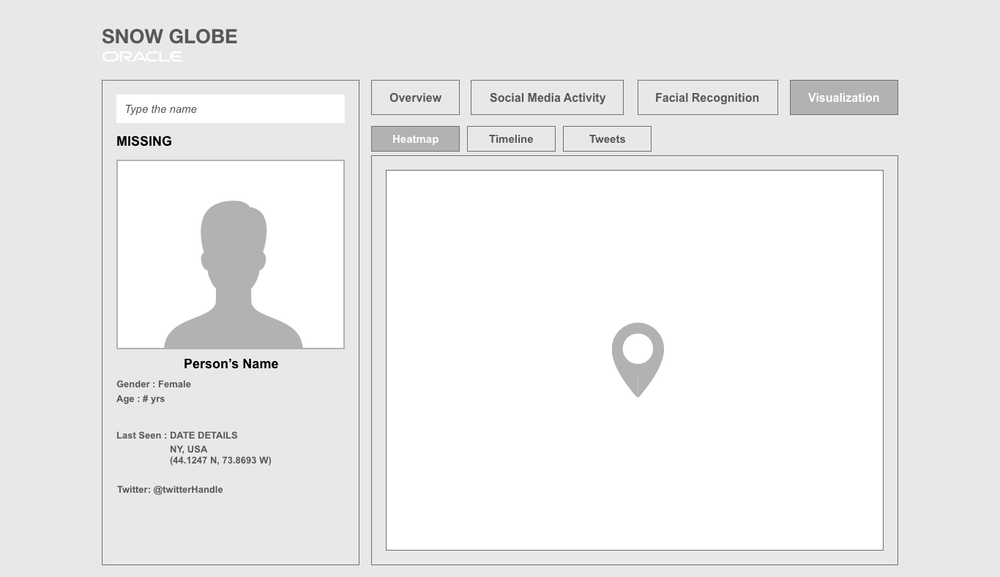
Visualization – Heatmap
The Heatmap view translates location-based data into an intuitive geographic representation, highlighting areas of high activity density. By visualizing latitude and longitude clusters, users can quickly identify hotspots and movement concentration without parsing raw coordinates. This provides an immediate spatial understanding of presence and behavior over time.
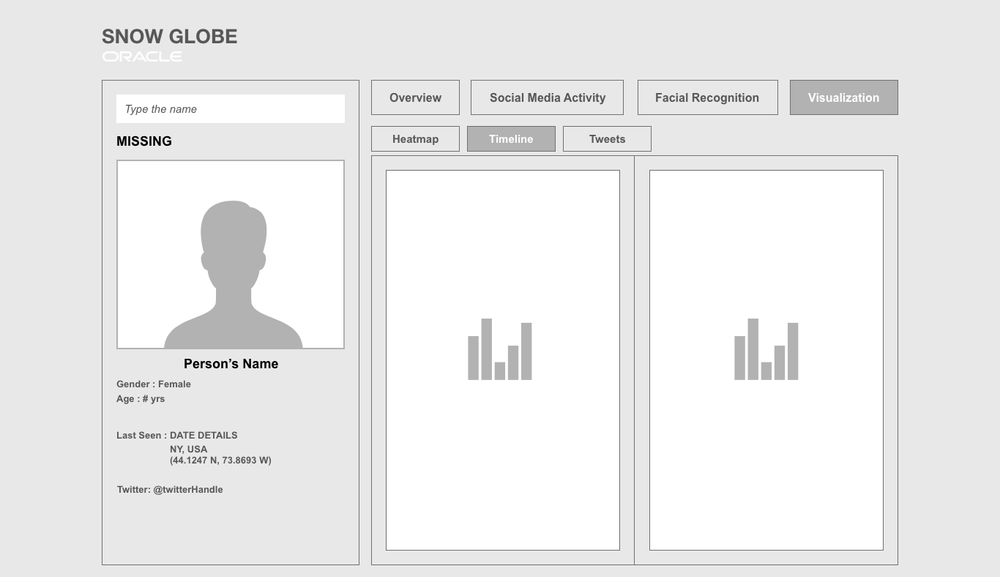
Visualization – Timeline
The Timeline view organizes activity chronologically, allowing users to track patterns, spikes, and gaps in behavior over a defined period. By presenting data as a sequence of events, it supports temporal analysis and helps users understand how activity evolves. This view is particularly useful for identifying anomalies or correlating events across different data sources.
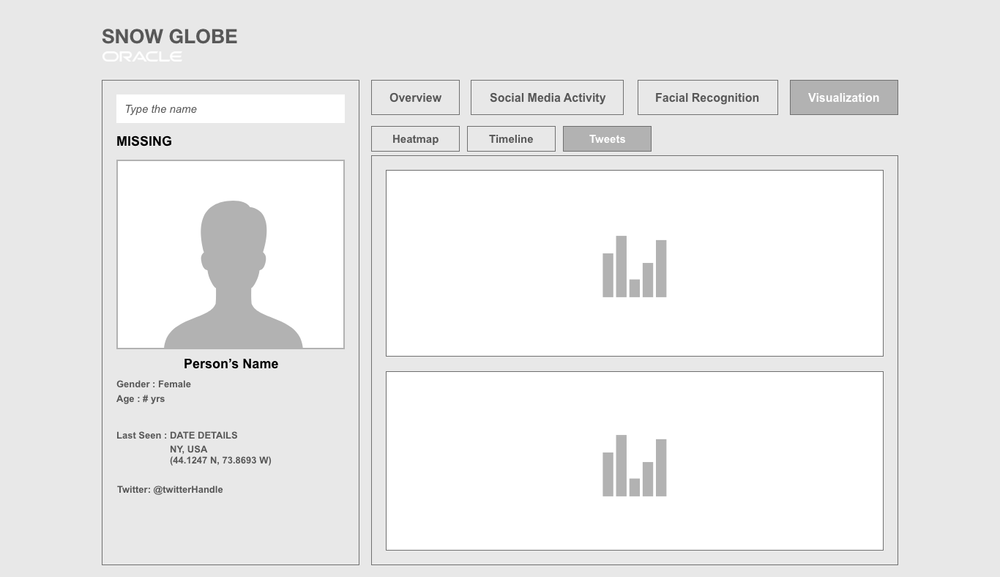
Visualization – Metrics (Tweets & Activity)
The Metrics view breaks down activity into quantifiable insights through simplified charts and comparative visuals. It highlights trends such as tweet frequency, engagement patterns, or other measurable signals, enabling users to quickly assess behavioral intensity and changes over time. This section complements other views by translating raw data into digestible performance indicators.
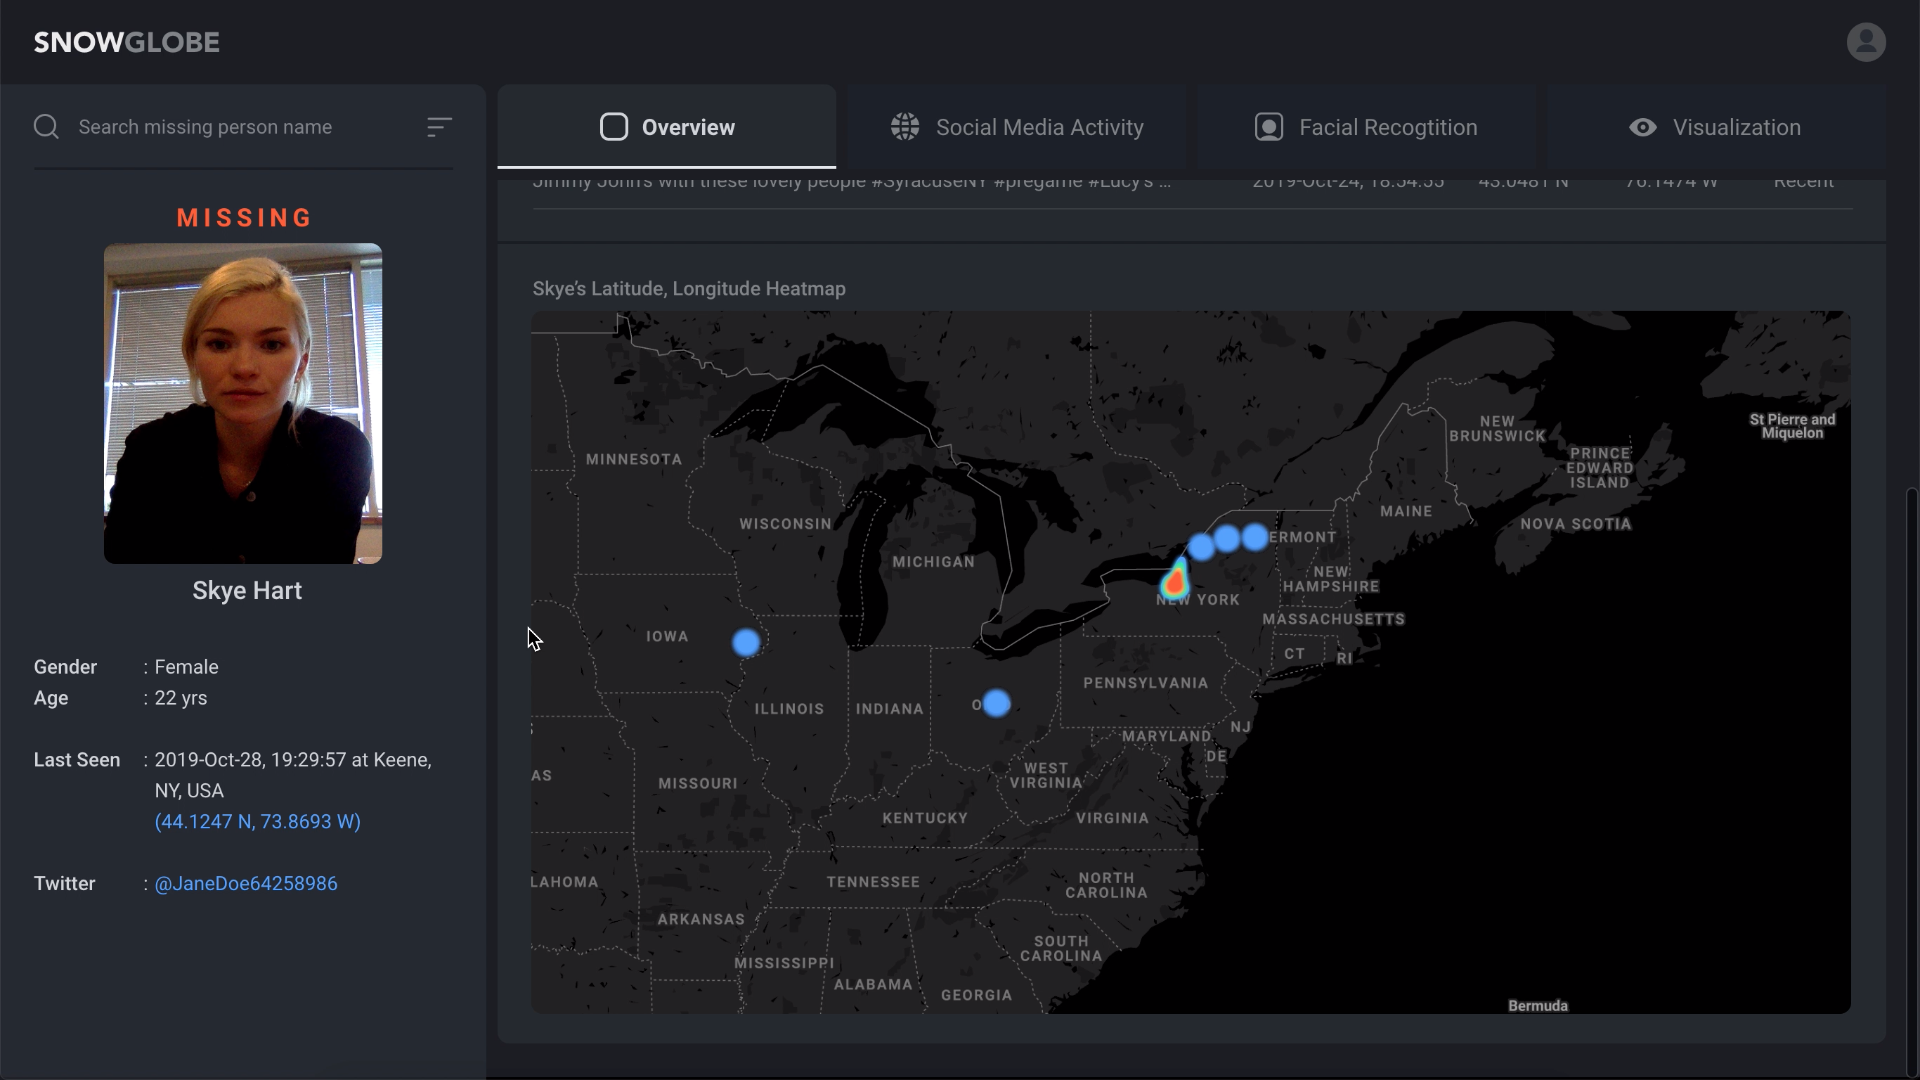
Final Design
After finalizing the wireframes, I partnered with a visual designer to elevate the experience into a high-fidelity prototype, ensuring the interface was not only functional but also clear, cohesive, and usable in high-pressure contexts.
This phase focused on refining visual hierarchy, improving data readability, and aligning interactions with real-world workflows. We then conducted an additional round of user testing to validate these refinements, identify any remaining usability gaps, and ensure the design effectively supported critical tasks. Insights from this round informed final adjustments before submitting the solution for the hackathon competition.
#madhacks@oracle

Winning the hackathon competition
Our team participated in Madhacks, a yearly hackathon event where Oracle engineers from various cities and countries can participate and share their projects and demonstrate their skills to solve real world problems using oracle technology.
Snowglobe won 1st place in the local, regional and global hackathon competition against other teams who participated in the hackathon.
Outcome & Real-World Impact
Winning the hackathon created an opportunity to extend the concept beyond a prototype and into real-world collaboration. The exposure led to partnerships with internal teams and external organizations, enabling us to further explore how Oracle’s technology stack could be applied in operational environments.
This experience reinforced the value of the design by demonstrating its applicability in high-stakes scenarios and highlighted how a rapid, concept-driven initiative could evolve into a tool that supports meaningful, real-world impact.
While this project concluded as part of the MadHacks program, the research and concepts generated during the effort laid the groundwork for Oracle OATS, a subsequent project focused on advancing the vision of a more connected and efficient investigative platform.